最近有个问题,如何用R来生成RTF报告,报告中包括一些表格和图表
这个需求在一些药企通常会用SAS来生成,但是我对于SAS不太熟练(虽然也会用一点SAS来生成一些常规表格);并且觉得SAS过于繁琐,可拓展性不够,因此想找寻一种可用R来替代的方法
在测试过多个R包以及相关方法,最后决定使用rmarkdown搭配huxtablesr包来生成RTF报告,原因如下:
- 在R中可使用rmarkdown快速出具报告,功能齐全,可拓展性强,最主要可导出RTF报告
- 能在rmakrdown中生成表格并支持导出RTF的表格R包大致有:
knitr::kable()和huxtable::hux();之前比较喜欢用的flextable包不支持(not supported)导出RTF,gt包也同样暂时不支持(Under development) - 为了满足工作上的需求,
huxtable包可操作性更强,基本上能满足常规设置以及一些个性化的需求
对于不同的R包在rmarkdown中支持的导出格式,有人做了个总结(下表中缺少huxtable包,但可认为其对于HTML/PDF/RTF/WORD全都支持!)

Introduction
作者对于各个同类R包(For tables)做了比较说明,我摘抄一段如下,具体详情可见:Design Principles, Comparisons and Limitations
huxtablehas the widest range of outputs, including HTML, LaTeX, RTF, markdown and Word (via flextable). It is very customizable. Its model is drawn from HTML, which can be tricky when outputting LaTeX. It aims to give you fine-grained control over formatting, at cell level wherever possible.- David Gohel’s
flextablepackage started off as a way of producing Word and Powerpoint tables. It can also output markdown tables for use in rmarkdown documents. Recently it gained the ability to create PDFs using the pagedown package. Rather than outputting LaTeX, this uses paged HTML. In my view this is a fabulous idea, since LaTeX is a 1980s leftover that needs to die. But, if you need LaTeX, then it won’t help. On the other hand,huxtableusesflextableto produce Word output, so if you only need Word, you might as well go to the source. - RStudio’s
gtpackage is powerful and has a big name behind it. As yet it only produces HTML, but PDFs are on the agenda. It aims for more convenience than control, with included functions for many standard formatting options. kableExtrais a simple set of tweaks for theknitr::kable()function. I am not a huge fan of the internal design, but it produces nice output and has a helpful website.
对于huxtable包的使用方法,可参照官方文档:Introduction to Huxtable
以下是我整理的一些用法,主要用于生成类似与SAS的三线表
echo 1
2
3
4
5
6
7
8
9
10
11
12
13
14
15
16
17
18
19
20
21
22
23
24
25
26
library(huxtable)
library(dplyr)
ht <- hux(
Employee = c('John Smith', 'Jane Doe', 'David Hugh-Jones'),
Salary = c(50000L, 50000L, 40000L),
add_colnames = TRUE
)
ht %>%
# set_right_padding(1) %>%
# set_left_padding(1) %>%
set_top_padding(0.1) %>%
set_bottom_padding(0.1) %>%
set_bold(1, everywhere, TRUE) %>%
# set_top_border(1, everywhere, 1) %>%
# set_bottom_border(1, value = 1) %>%
# set_bottom_border(nrow(ht), value = 1) %>%
theme_article() %>%
set_align('center') %>%
set_width(1) %>%
set_height(0.025) %>%
set_number_format(2) %>%
set_font(value = "Times New Roman") %>%
set_caption('1.1 Employee table') %>%
set_caption_pos("topleft") %>%
add_footnote("* This is a footnote.", border = 1) %>%
set_font_size(value = 9)
其中各个参数的用法可参照函数说明或者示例,我简单介绍下:
set_top_padding和set_bottom_padding,用于设置行间距;默认的行间距有点宽,所以我设置的小一点set_bold,对于某行某列字体加粗set_top_border和set_bottom_border,可用于设置边框theme_article,选择三线表主题set_align,文字对齐set_width和set_height,对应行宽和行高set_number_format,数值格式,如小数点位数set_font和set_font_size,选择字体和字体大小set_caption和set_caption_pos,对应表标题及其位置add_footnote,对应脚注
表格结果如下:

其中主题的选择可参照Huxtable themes自行根据实际需求更改
各个参数有先后关系,比如把set_font_size放在add_footnote后面使得字体大小设置能影响到脚注;对于表标题的字体大小,用set_font_size是无效的,但可以用HTML对其进行设置,比如:set_caption("<span style='font-size: 8pt'>Sample Caption</span>"),此处参考:Huxtable package for R: How to set font_size() for caption() and footnote() for huxtables?
对于一些回归分析的结果,huxtable包提供了一个接口函数用于表格展示,可参照:Regression Tables with huxreg
对于一些单元格合并(Cell Merging)的处理(一个比较常见的需求),huxtable包也提供了相关的函数来生成,如merge_cells()函数,下面是一个简单的示例:
echo 1
2
3
4
5
6
7
8
9
10
11
12
13
14
15
16
17
18
19
20
21
22
23
24
25
26
27
28
29
30
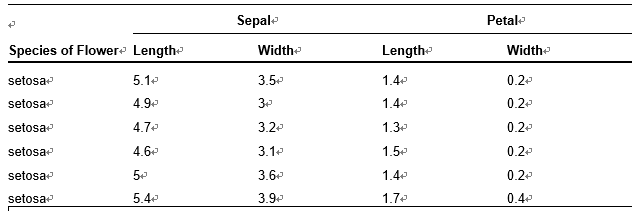
column_headers <- data.frame(
Species = c("", "Species of Flower"),
Sepal.Length = c("Sepal", "Length"),
Sepal.Width = c("", "Width"),
Petal.Length = c("Petal", "Length"),
Petal.Width = c("", "Width"),
stringsAsFactors = FALSE
)
iris <- head(iris)
# Create the huxtable table
huxtable::as_hux(rbind(column_headers, iris))[-1,] %>%
# Merge the Sepal cell over the Length and Width
huxtable::merge_cells(1, 2:3) %>%
# Merge the Petal cell over the Length and Width
huxtable::merge_cells(1, 4:5) %>%
# Align the top cells for both Sepal and Petal
huxtable::set_align(1,2, 'center') %>%
huxtable::set_align(1,4, 'center') %>%
# Bold all the column header rows
huxtable::set_bold(1:2, 1:ncol(iris), TRUE) %>%
theme_article() %>%
set_top_padding(0.1) %>%
set_bottom_padding(0.1) %>%
set_width(1) %>%
set_height(0.025) %>%
huxtable::set_bottom_border(1, 2:4, 1) %>%
huxtable::set_bottom_border(2, 1:ncol(iris), 2) %>%
set_font_size(value = 9)
结果示例图如下:
Summary
总而言之,从上述可看出,rmarkdown搭配huxtable包可以完成大部分SAS生成RTF报告的需求
并且在作者的帮助下,此方法也能支持中文表格,将在最新版中实现,可见issues
当然不可否认在一些RTF报告的细节上SAS处理的更加好一点,但是在R开发者的给力帮助下,希望能逐步替代SAS这部分的工作~
参考资料
https://hughjonesd.github.io/huxtable/huxtable.html
https://hughjonesd.github.io/huxtable/index.html
https://hughjonesd.github.io/huxtable/tutorials/
https://hughjonesd.github.io/huxtable/design-principles.html
https://cran.r-project.org/web/packages/gtsummary/vignettes/rmarkdown.html
本文出自于http://www.bioinfo-scrounger.com转载请注明出处