看完https://rmarkdown.rstudio.com和https://bookdown.org/yihui/rmarkdown/,发现rmarkdown在这些创作者手里竟然演变出这么多功能,这里我挑几个个人比较喜欢的功能简单的记录一下 #### Slide Presentations
R markdown支持将你的文档转化成幻灯片格式,比如比较常见的PDF幻灯片格式beamer_presentation,只需要修改你的YAML header
output: beamer_presentation然后在正文中用#以及##作为标题来分割内容(分割成一页页PPT),如果不想使用标题,也可以用---来分割,很简单哦,除此之外还有其他PPT格式,如下:
- ioslides_presentation - HTML presentations with ioslides
- slidy_presentation - HTML presentations with slidy
- powerpoint_presentation - PowerPoint presentation
- revealjs::revealjs_presentation - HTML presentations with reveal.js
Dashboards
这个让我想起了shiny的Dashboards,其实展现形式也差不多,都是在网页上加上了仪表盘,用来对内容进行分块;当你在使用网站的的例子时Dashboards,会发现其实其需要的那个flexdashboard包也是调用了shiny(这个例子需要安装好多包,一个个安装即可)
最终以一个静态网页的形式+仪表盘来展示内容,实在太棒了~~
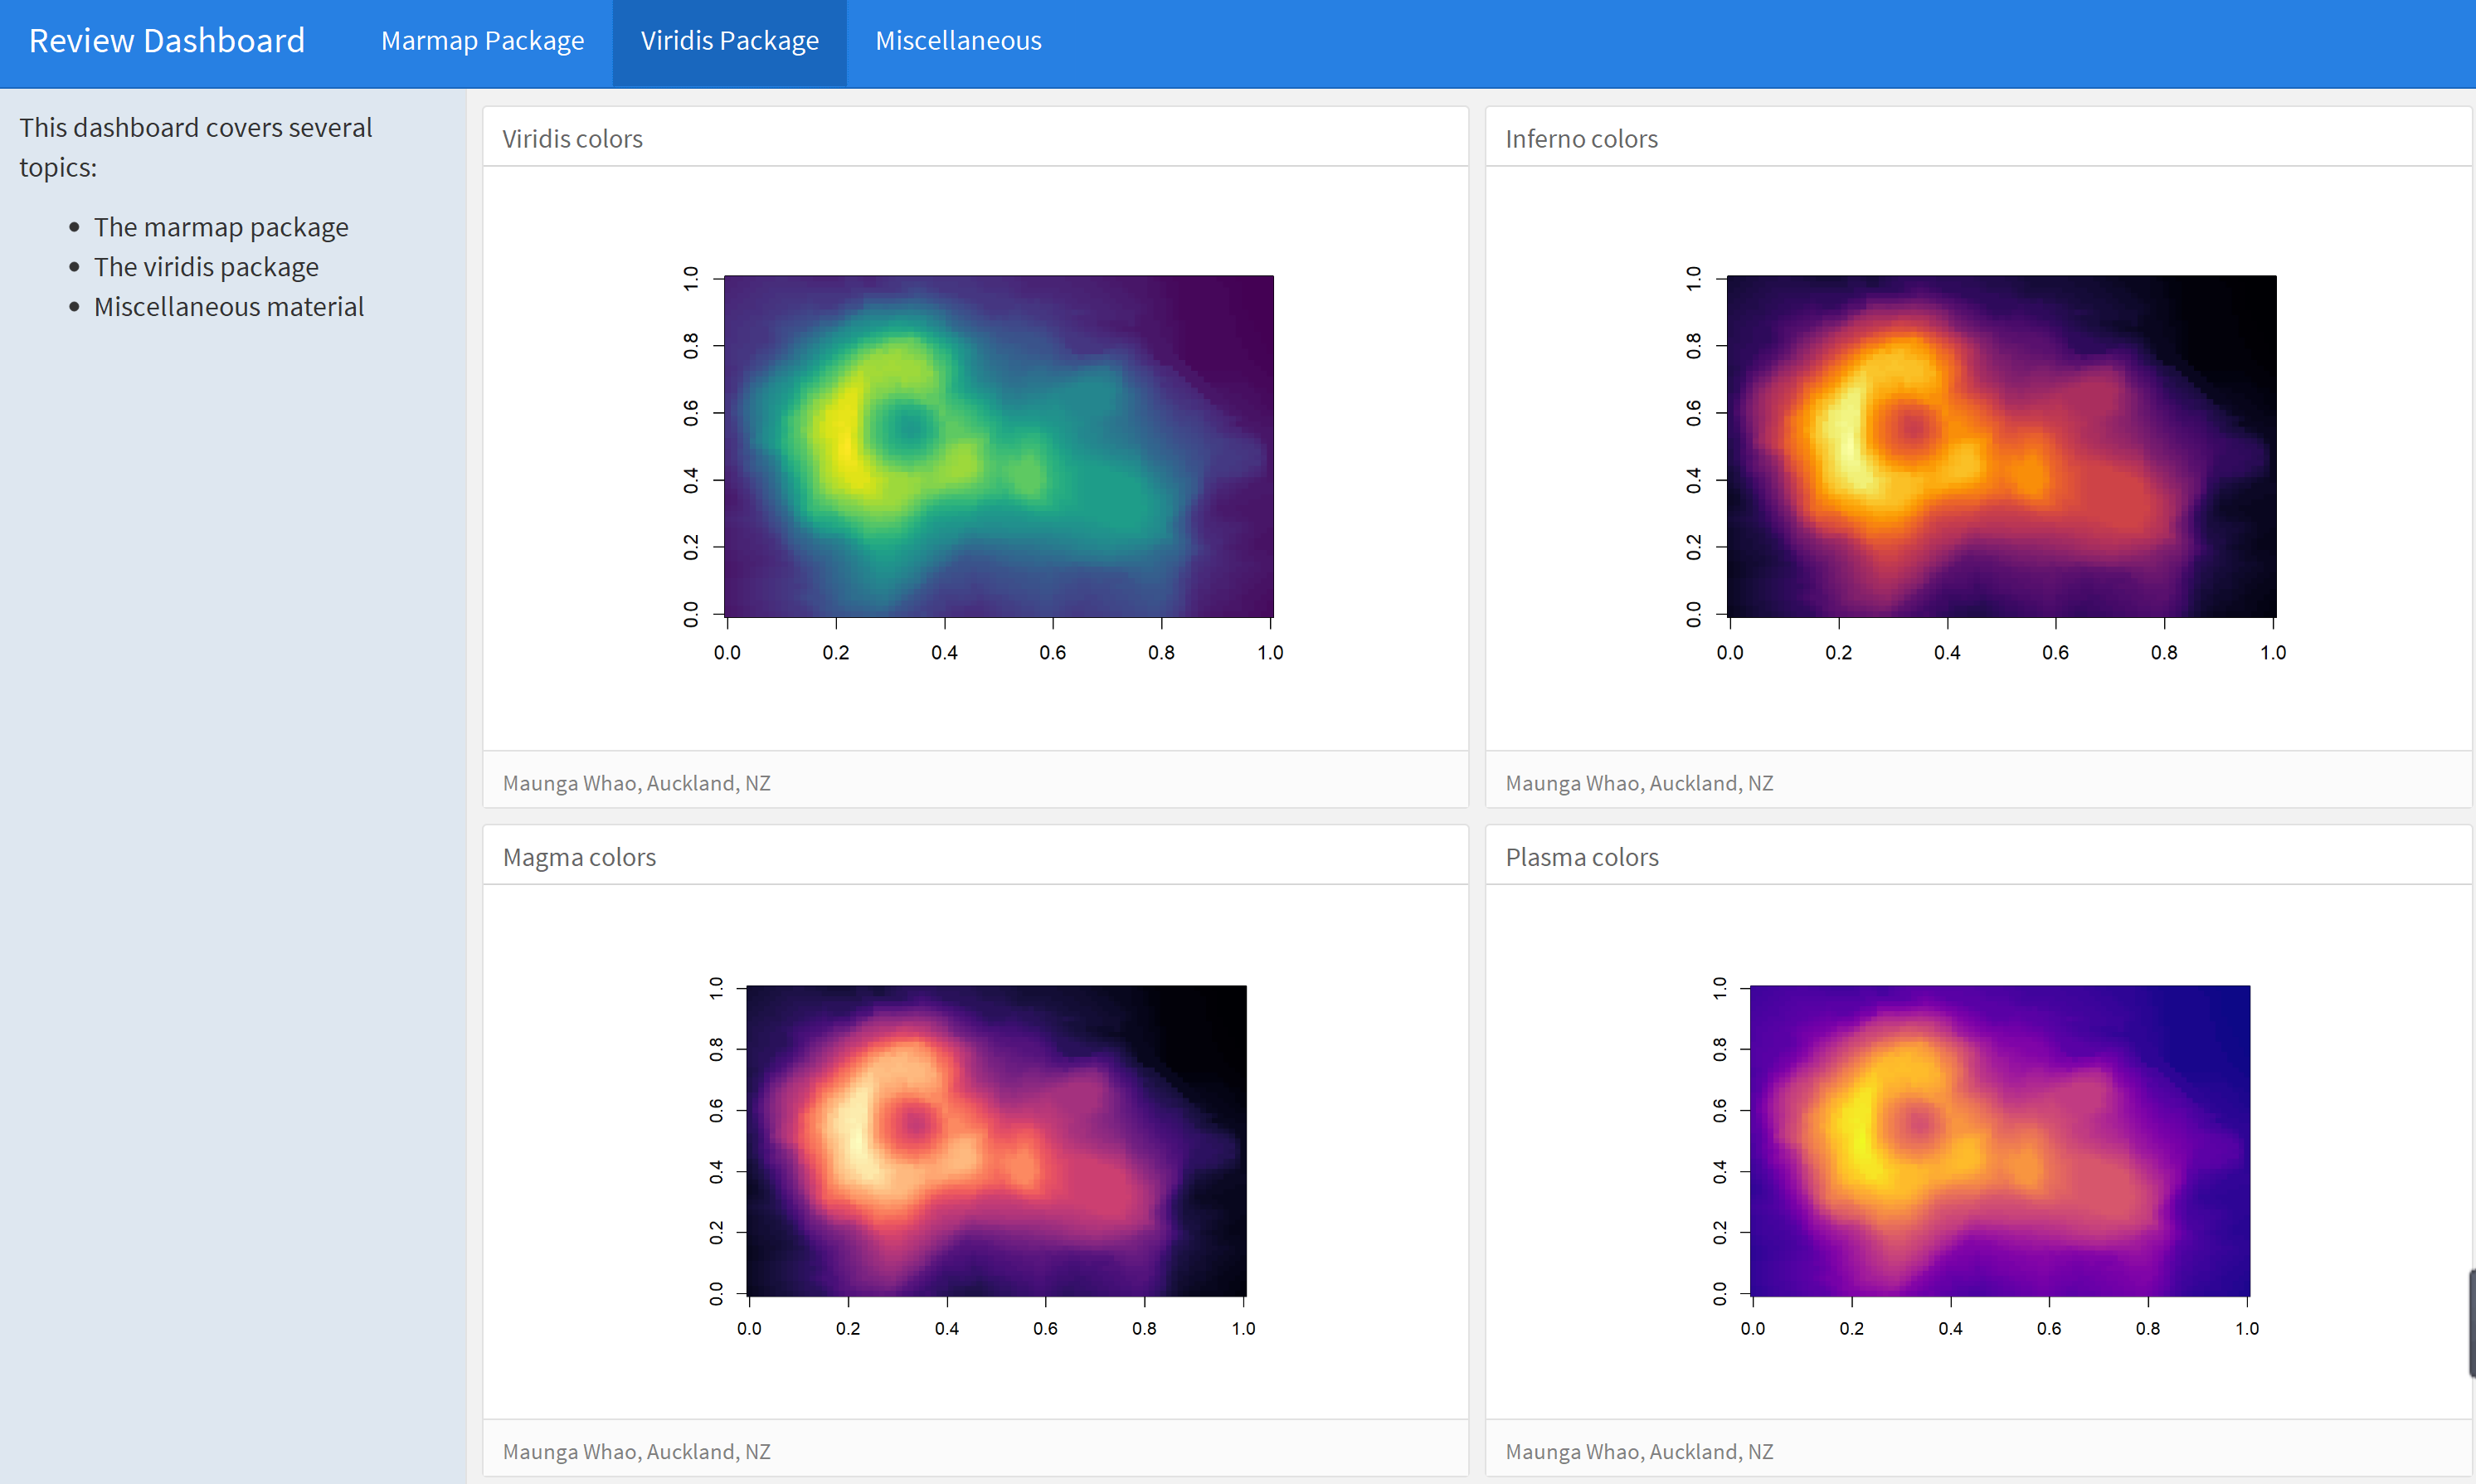
从示例来看,先选择你的Dashboards(同样是写在YAML上)
output:
flexdashboard::flex_dashboard:
orientation: columns然后分别用#,##和###对内容进行布局
#表示开始一个空白页(相当于在仪表盘上加入一块内容)##表示一column,多个##则是多列从左到右排布###表示一个box,多个box则是按照从上到下排布
当然你懂点HTML的话,可以通过对一些元素添加属性来进一步对网页进行修饰flexdashboard: Easy interactive dashboards for R
Interactive-shiny
之前在学习Shiny用法的时候,曾见识到在shiny中用rmarkdown,其实在rmarkdown生成的HTML中也可以嵌入shiny程序,作为网页的一部分展示效果
学习过程可以按照https://bookdown.org/yihui/rmarkdown/shiny-start.html中介绍的一步步来,需要点懂一些shiny的用法,照搬个文档中的简单例子(但是个人觉得非常实用)
就按照文档中所示的简单例子,先写个YAML
---
title: "test"
runtime: shiny
output: html_document
---
再在以rmarkdown格式下写上一段shiny代码(用于动态展示不同cars下的表格结果)
echo 1
2
3
4
5
numericInput("rows", "How many cars?", 5)
renderTable({
head(cars, input$rows)
})
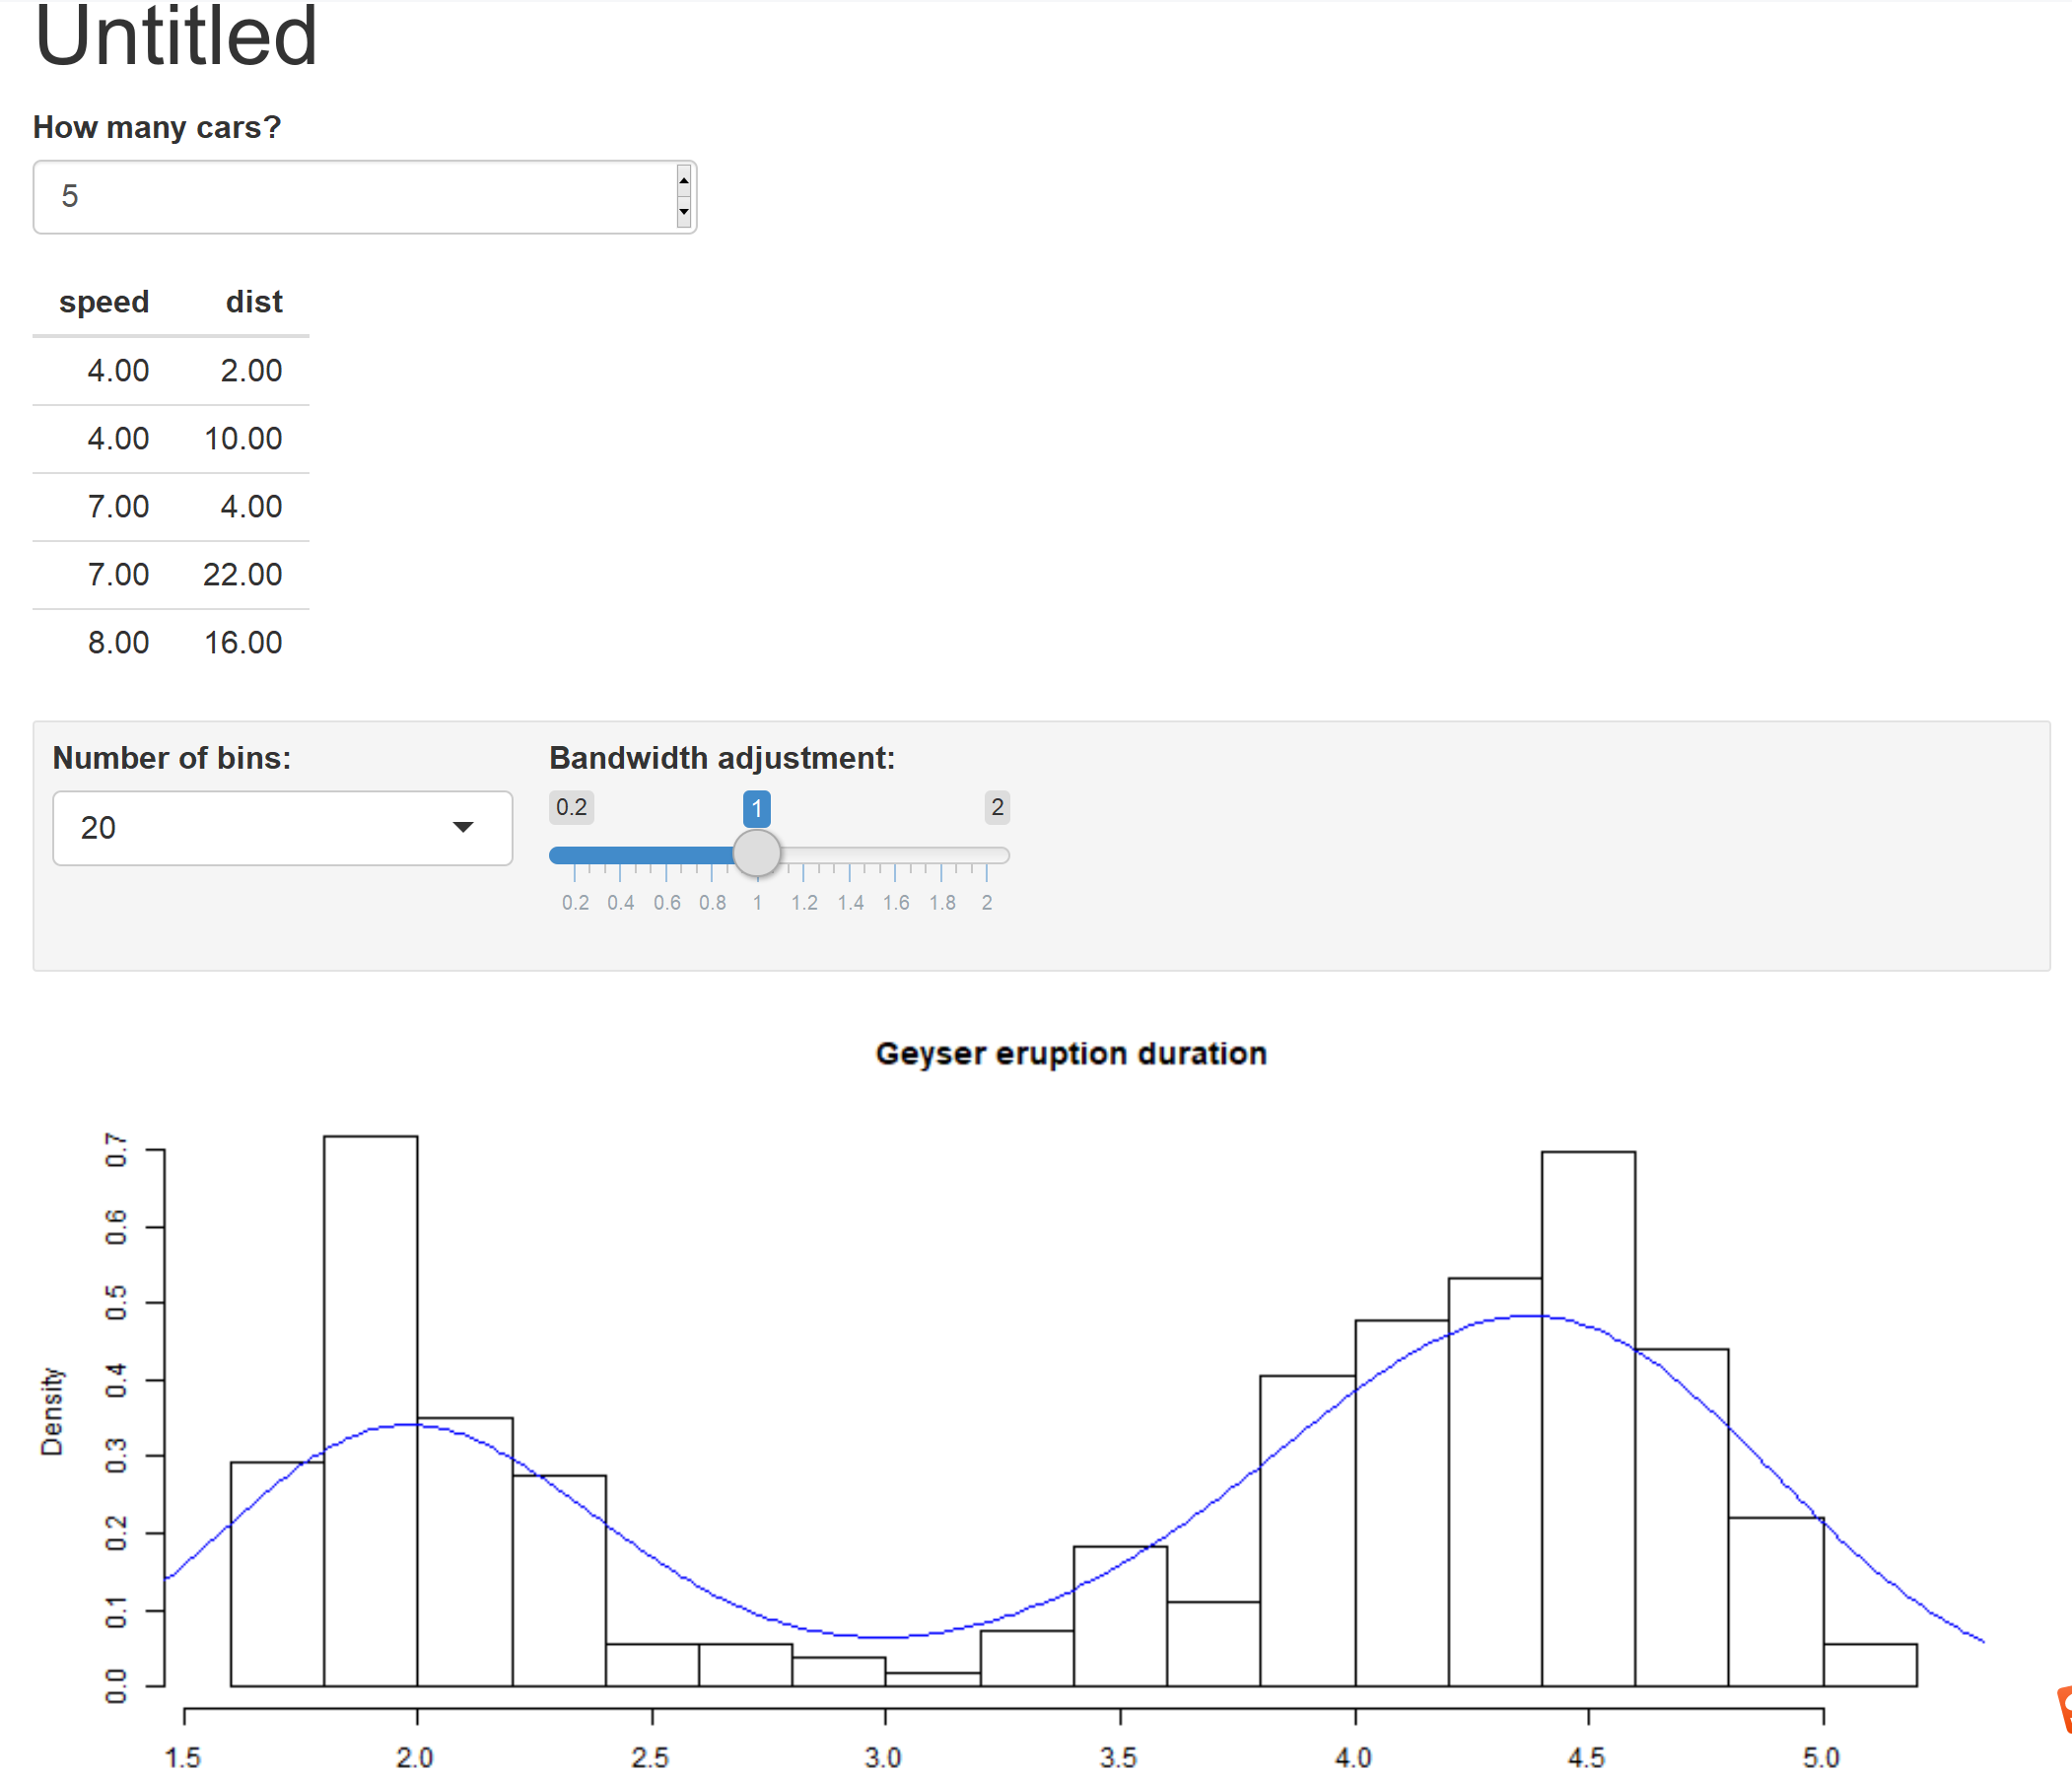
或者略微复杂一点的(上下分别是ui和server两部分,前者用于控制输入数据,后者可以认为是处理并展示数据)
eruptions, echo 1
2
3
4
5
6
7
8
9
10
11
12
13
14
15
inputPanel(
selectInput("n_breaks", label = "Number of bins:",
choices = c(10, 20, 35, 50), selected = 20),
sliderInput("bw_adjust", label = "Bandwidth adjustment:",
min = 0.2, max = 2, value = 1, step = 0.2)
)
renderPlot({
hist(faithful$eruptions, probability = TRUE, breaks = as.numeric(input$n_breaks),
xlab = "Duration (minutes)", main = "Geyser eruption duration")
dens <- density(faithful$eruptions, adjust = input$bw_adjust)
lines(dens, col = "blue")
})
结果如下图所示:
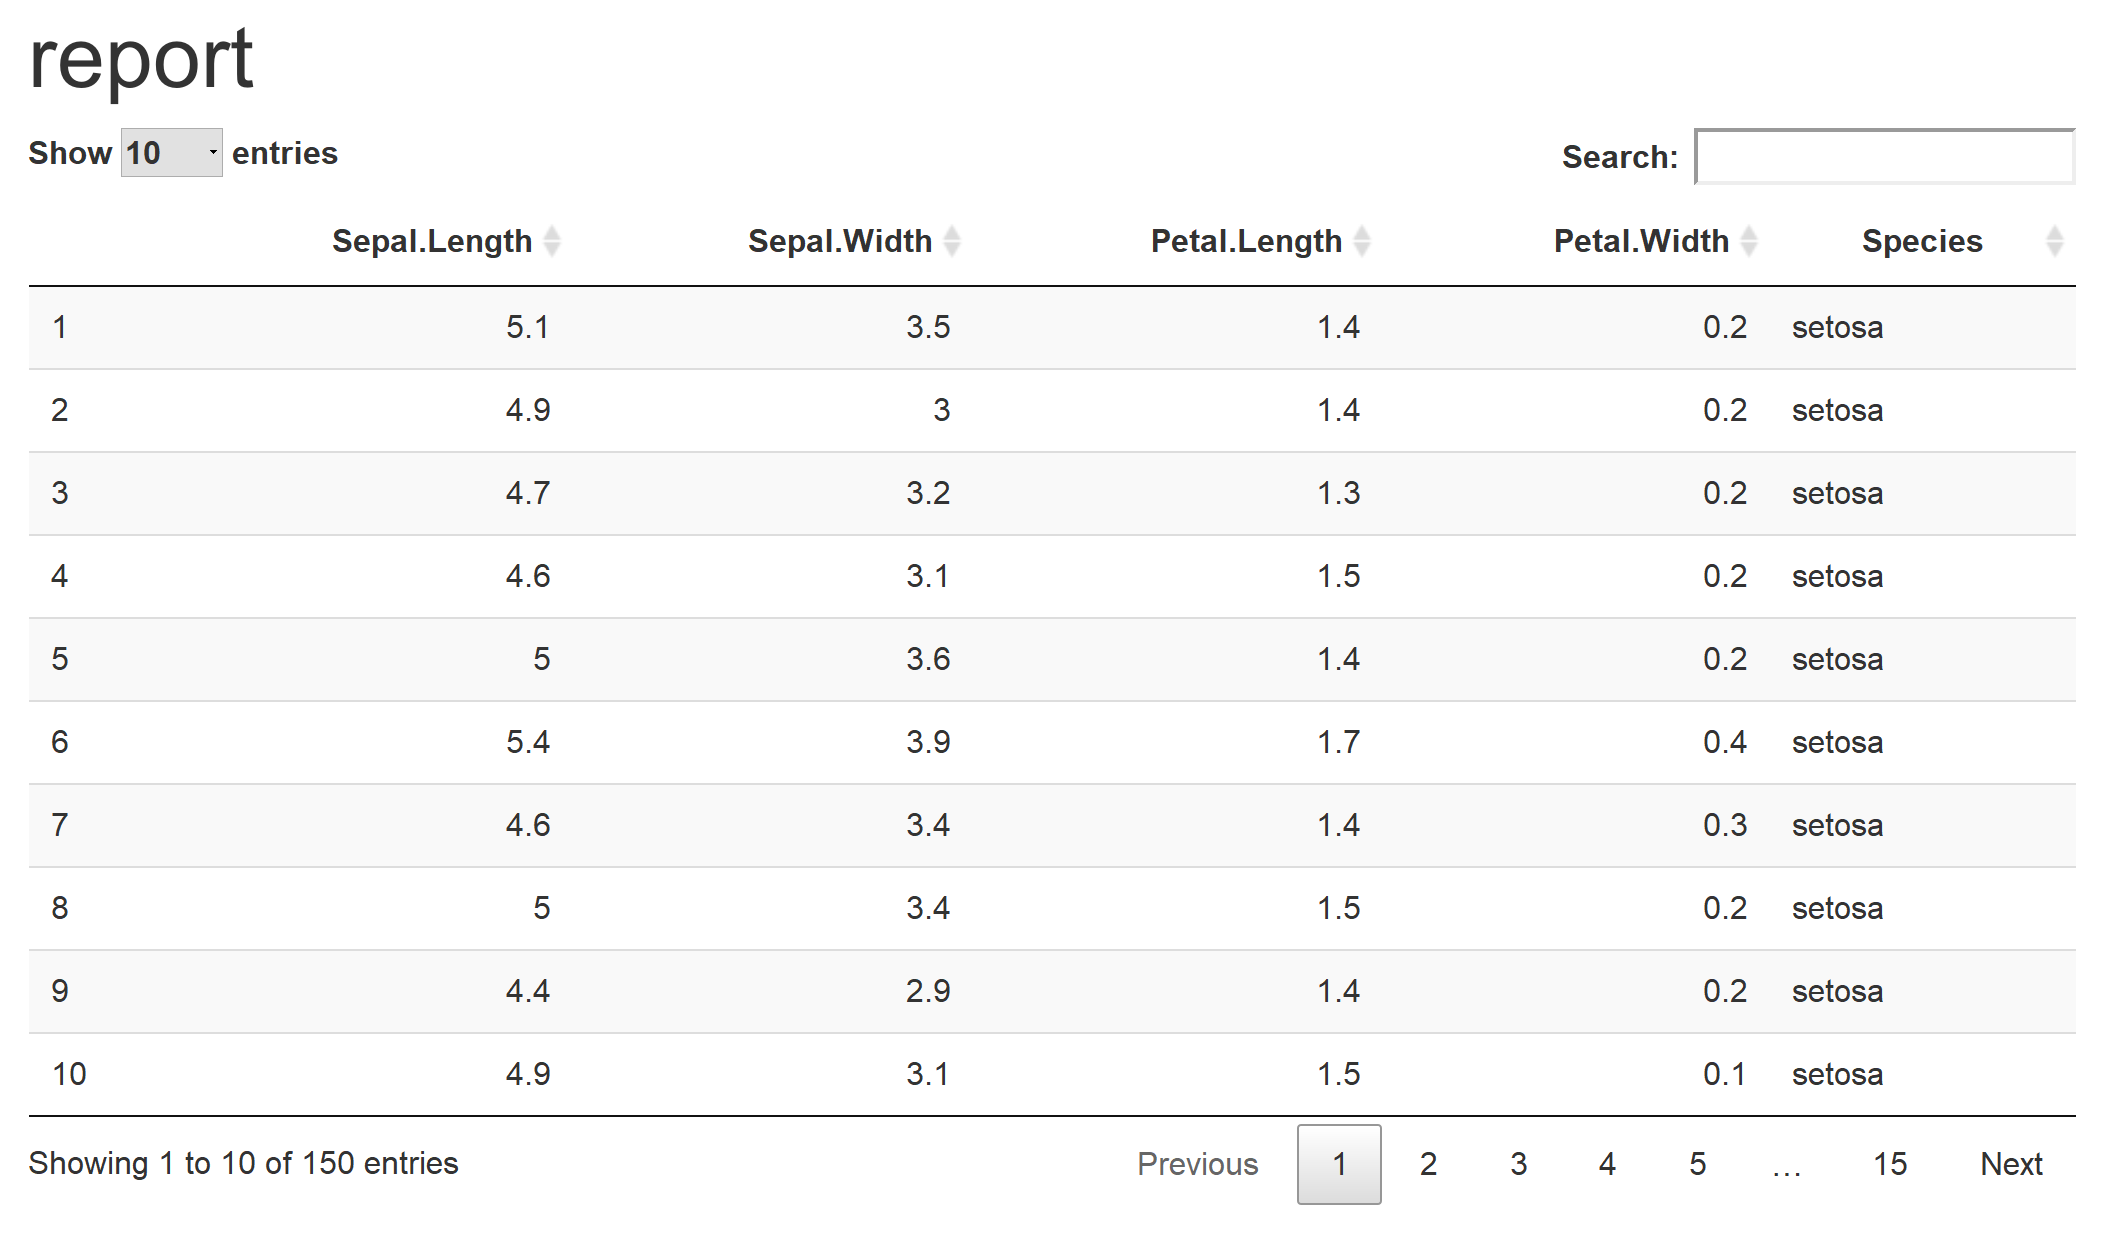
如果觉得上面用shiny太麻烦,如果又想动态展示表格,那么我觉得DT包就比较合适
就在你html输出的框架下,用DT包的datatable函数来输出你的表格即可,比如以iris数据集为例
---
title: report
output: html_document
---
include 1
library(DT)
echo 1
datatable(iris)
展示效果也不错哦,如下图:
最后再强烈推荐通读R Markdown: The Definitive Guide
本文出自于http://www.bioinfo-scrounger.com转载请注明出处