karyoploteR是一个bioconductor的一个R包,用于定制非环形全基因组数据的可视化。其绘图绘图过程按照R的基本绘图系统,并且不需要其他图形包。karyoploteR旨在给使用者提供一种可以创建任何线性染色体基因组的表征,并在染色体上绘制相关基因组注释和实验数据。 karyoploteR仅仅只是一个绘图工具,因此意味着无法用这个R包来下载数据,需要使用者自己去下载然后导入R,这是这个R的一个不足之处。但其优点在于其不依赖数据库,因此可以绘制来自于各个地方的基因组数据。除了一点例外, ideograms cytobands是默认来自于UCSC。
这个软件特点也在于其灵活性,可以根据自己需求对图形做一系列的个性化操作。
karyoploteR可以满足常规的全基因组可视化需求,例如:
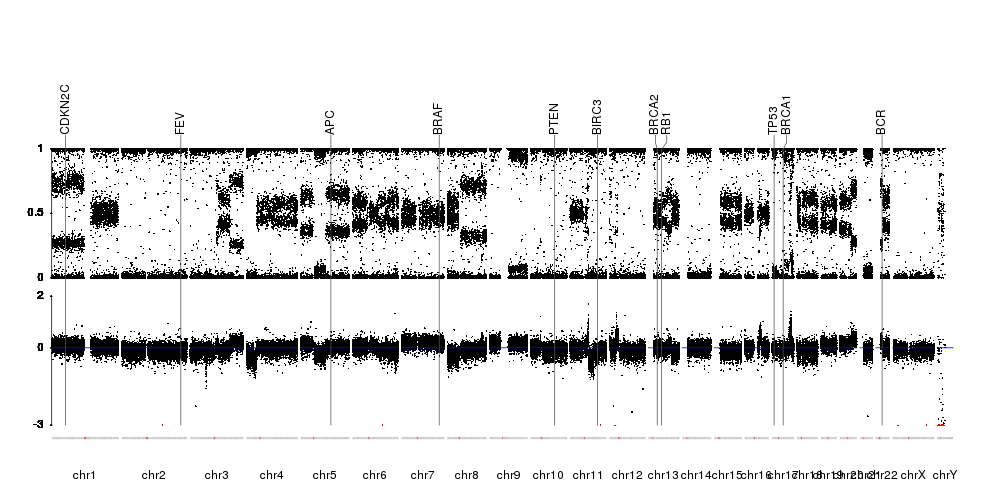
It can be used to plot somatic copy-number changes (SCNA) in cancer genomes obteined from exome, aCGH or SNP-array data
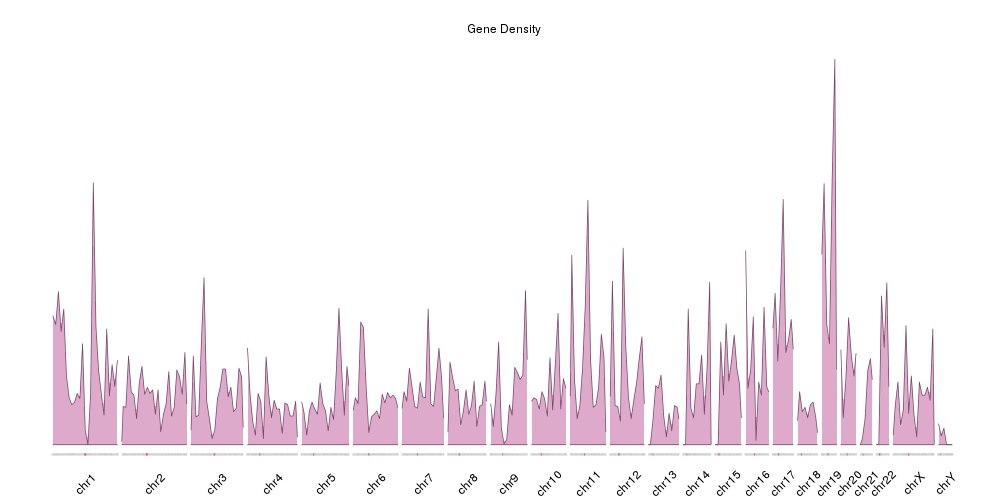
to plot the global BAM coverage from a WGS experiment
to create manhattan plots from GWAS studies
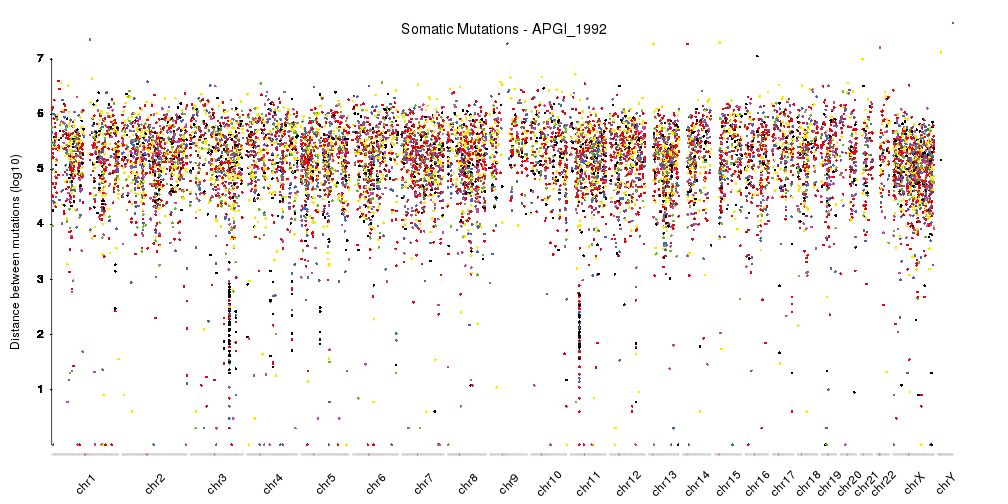
to create rainfall plots to detect kataegis
Links
Bioconductor: http://bioconductor.org/packages/karyoploteR/.
需要注意的是:karyoploteR是Bioconductor的一部分,而且是基于BioC 3.5,所以需要将Bioconductor升级到3.5才能安装karyoploteR包,而bioconductor 3.5需要先将R升级到3.4才行Tutorial and Examples: https://bernatgel.github.io/karyoploter_tutorial/
本文出自于http://www.bioinfo-scrounger.com转载请注明出处