The box plot is used to demonstrate the data distribution in common and to look for outliers. We can also see where the 25% and 75% quarters are, as well as the median value from the box. As a result, it's a very helpful visual chart.
Let's see a demo.
library(ggplot2)
library(tidyverse)

# Data
data(iris)

ggplot(iris, aes(x = Species, y = Sepal.Length,
                 colour = Species)) +
  geom_boxplot()
Adding jittered points to the box plot in ggplot is useful to see the underlying distribution of the data. You can use the geom_jitter function with few params. For example, width param to adjust the width of the jittered points.
ggplot(iris, aes(x = Species, y = Sepal.Length,
                 colour = Species, shape = Species)) +
  geom_boxplot() +
  geom_jitter(width = 0.25)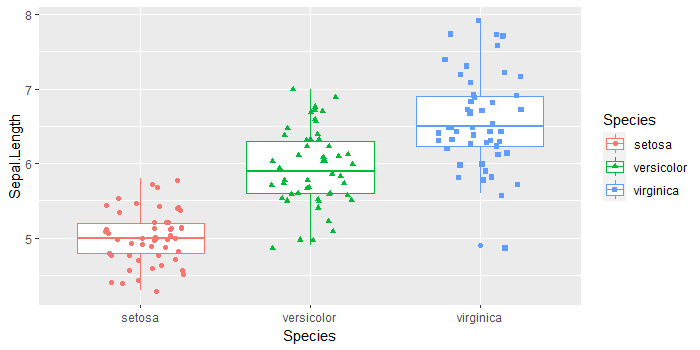
Sometimes, we might try to add jittered data points to the grouped boxplot, but we can not use the geom_jitter() function directly as it's a handy shortcut for geom_point(position="jitter"). Let's see what chart will be generated as shown below. It makes the grouped boxplot with overlapping jittered data points.
ggplot(iris2, aes(x = Species, y = Sepal.Length,
                 colour = group, shape = group)) +
  geom_boxplot() +
  geom_jitter(width = 0.25)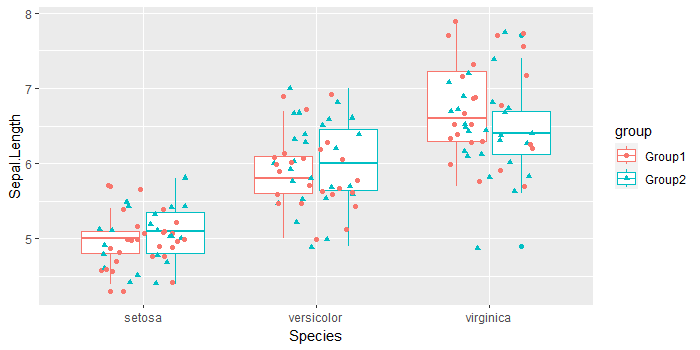
Natively, how to make a better and correct jittered data points to the grouped boxplot. We can use the position_jitterdodge() as the position param, inside the geom_point function.
ggplot(iris2, aes(x = Species, y = Sepal.Length,
                  colour = group, shape = group)) +
  geom_boxplot() +
  geom_point(position = position_jitterdodge(jitter.width = 0.25))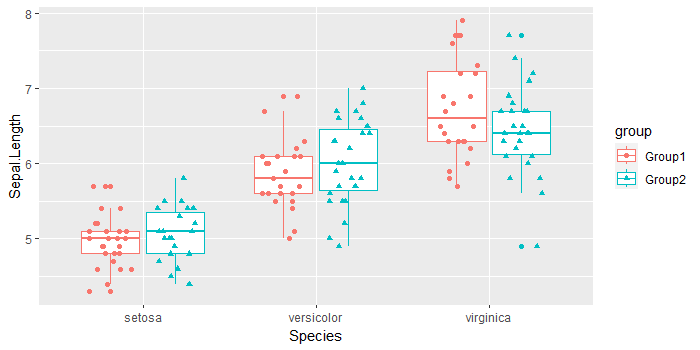
Right now, we get a nice looking grouped boxplot with clearly separated boxes and jittered data points within each box.
Reference
https://r-charts.com/distribution/box-plot-jitter-ggplot2/
https://datavizpyr.com/how-to-make-grouped-boxplot-with-jittered-data-points-in-ggplot2/