We all know that IML/SAS make us use R code in SAS by submit /R statement. A few months ago, I consulted with SAS support for how to import plots by R in IML into RTF templates directly as I could not find any useful information in google. Unfortunately SAS support told me if the plot was created in R, it would need to be saved within the submit block as well using R code. It means if you want to directly import R graphics to RTF, maybe you should use some R function to achieve it.
However I found a post (Mixing SAS and R Plots) that illustrates how to mix SAS plots and R plots in one graph by chance, which could solve my question perfectly. So let’s have a look at how to generate a plot by R in SAS and import it to RTF or PDF. It seems not directly but a trick I think.
Firstly, as usual we draw a R graphic in SAS.
proc iml;
  submit /R;
  library(ggpubr)
  data("ToothGrowth")
  ggviolin(ToothGrowth, x = "dose", y = "len", add = "none") %>%
    ggadd(c("boxplot", "jitter"), color = "dose") %>%
    ggsave(filename = "C:/Users/anlan/Documents/plots/violin.png", width = 10, height = 8, units = "cm", dpi = 300)
  endsubmit;
  call ImportDataSetFromR("work.ToothGrowth", "ToothGrowth");
run;
quit;
And then set output style to rtf template and graphics with png of 12cm height and 15cm width. This should be noted that the height and width point to the size of the graphic, not the actual plot size.
ods rtf file = "C:/Users/anlan/Documents/plots/outgraph.rtf";
ods graphics / noborder height=12cm width=15cm outputfmt=png;
Next we use the SAS Graph Template Language(GTL) to define a template and use the drawimage statement to import the R graphic into SAS. The width and height params in the drawimage statement is used to adjust the size of the image’s bounding box (actual size). In this example, width=90 widthunit=percent means the plot is zoomed out to 90%.
proc template;
  define statgraph plottemp;
    begingraph;
      layout overlay;
        drawimage "C:/Users/guk8/Documents/plots/violin.png" / width=90 widthunit=percent height=90 heightunit=percent;
      endlayout;
    endgraph;
  end;
run;
The final plot in RTF is as following:
proc sgrender template=plottemp; run;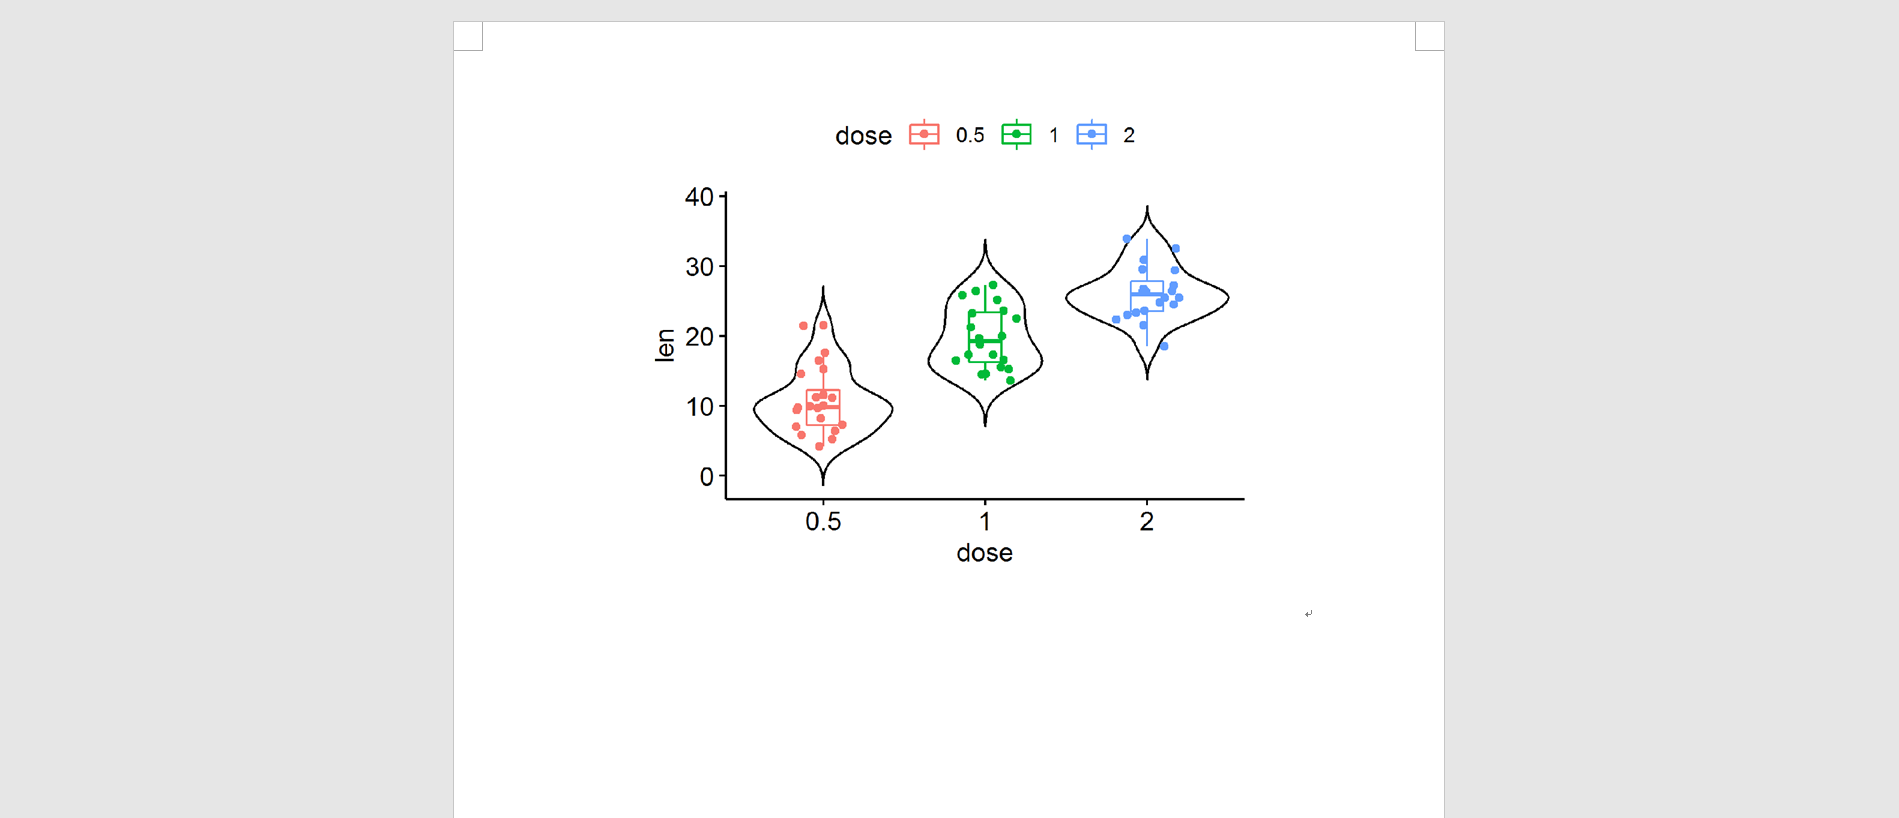
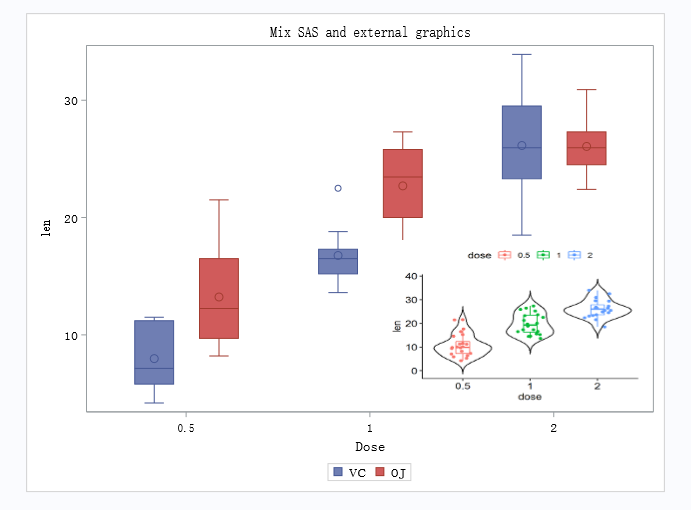
Actually the drawimage statement is designed to import the external graphics to SAS graph, to display a mixed graph. For example I’d like to show a graph having an image at the right-bottom of the total graph.
proc template;
  define statgraph mgraphic;
    begingraph;
      entrytitle "Mix SAS and external graphics";
      layout overlay;
        boxplot y=len x=dose / name="box"
           group=supp groupdisplay=cluster
           spread=true;
        discretelegend "box";
        drawimage "C:/Users/anlan/Documents/plots/violin.png" /
          width=45 widthunit=percent height=45 heightunit=percent
          anchor=bottomright x=98 y=2
          drawspace=wallpercent ;
      endlayout;
    endgraph;
  end;
run;
proc sgrender data=work.ToothGrowth template=mgraphic;
  label dose="Dose";
run;
The mixed graphic is as following:
Great, it seems easy to achieve. Obviously it definitely can be achieved in R using some useful functions as well.
Reference
Mixing SAS and R Plots
DRAWIMAGE Statement
Hands-on Graph Template Language: Part B
BOXPLOT Statement
SAS Boxplot – Explore the Major Types of Boxplots in SAS
Please indicate the source: http://www.bioinfo-scrounger.com