统计汇总表是一个非常有用的数据展示方法,比如临床分析中,临床三线表就是一个典型的例子
一般在处理数据时,如果想对数据集做点简单统计,Hmisc包的describe函数会比较好用;如果想将统计汇总结果以html形式作为最终展示,这是可以参照这篇博文(写得非常的帮!!!)-- How to Easily Create Descriptive Summary Statistics Tables in R Studio – By Group,因此分享一下,该文章总共归纳了9个用于创建汇总表的R包: * arsenal * qwraps2 * amisc * table1 * tangram * furniture * tableone * compareGroups * htmltable
下面我主要记录下table1包和arsenal包的使用经验,其他包以及更加详细的参数调整可看具体对应的文档
由于这篇文章写于19年,后续上述相关R包已有更新,因此下方的代码及文字仅供参考,以作者的说明文档为主。本篇文章于2022年做略微修改
常规的需求上述包均能实现,差别在于不同的展现形式罢了,因此有需求的话可以都试用下
其中table1包可能是见的比较多的,对其衍生的包也有些;常见的用法可见其文档:Using the table1 Package to Create HMTL Tables of Descriptive Statistics
其中我比较感兴趣的是其可以人为个人性化的增加多列信息,比如在其文档中增加了统计分析的P值;而我的需求则是则是增加多列,如统计量和P值两列,因此可参照作者的说明文档例子做略微修改,从而实现可以增加N列信息,比如代码如下:
library(MatchIt)
library(table1)
data(lalonde)
lalonde$treat <- factor(lalonde$treat, levels=c(0, 1), labels=c("Control", "Treatment"))
lalonde$married <- as.logical(lalonde$married == 1)
lalonde$nodegree <- as.logical(lalonde$nodegree == 1)
lalonde$race <- factor(lalonde$race, levels=c("white", "black", "hispan"),
labels=c("White", "Black", "Hispanic"))
label(lalonde$race) <- "Race"
label(lalonde$married) <- "Married"
label(lalonde$nodegree) <- "No high school diploma"
label(lalonde$age) <- "Age"
label(lalonde$re74) <- "1974 Income"
label(lalonde$re75) <- "1975 Income"
label(lalonde$re78) <- "1978 Income"
units(lalonde$age) <- "years"
pvalue <- function(x, ...) {
# Construct vectors of data y, and groups (strata) g
y <- unlist(x)
g <- factor(rep(1:length(x), times=sapply(x, length)))
if (is.numeric(y)) {
# For numeric variables, perform a standard 2-sample t-test
p <- t.test(y ~ g)$p.value
} else {
# For categorical variables, perform a chi-squared test of independence
p <- chisq.test(table(y, g))$p.value
}
# Format the p-value, using an HTML entity for the less-than sign.
# The initial empty string places the output on the line below the variable label.
c("", sub("<", "<", format.pval(p, digits=3, eps=0.001)))
}
stats <- function(x, ...) {
y <- unlist(x)
g <- factor(rep(1:length(x), times=sapply(x, length)))
if (is.numeric(y)) {
s <- t.test(y ~ g)$statistic
} else {
s <- chisq.test(table(y, g))$statistic
}
c("", sprintf("%.4f", s))
}
table1(~ age + race + married + nodegree + re74 + re75 + re78 | treat,
data=lalonde, overall=F, extra.col=list(`P-value`=pvalue, `statistic`=stats))
但是table1包没有给定函数用于导出html文件,除非手动在Rstudio中导出,或者使用htmltools包的save_html函数来导出;但是导出的html格式的表格会缺失一些样式,比较尴尬。。。
因此我后来试了下arsenal包,该包功能非常齐全(开发者真给力!),上述文章作者也给出了Powerfull评价,从修改表格形式以及导出均有函数可调用,可查看文档:The tableby function
我感兴趣的是该包的html导出的方法,其是使用了rmarkdown的形式进行结果导出,所以如果懂得如何使用rmarkdown,就大致会明白其原理了(值得学习下);因此在使用这个功能的前提,需要先安装好rmarkdown以及pandoc等配置
其导出函数可以支持.csv、html以及doc等格式。。。
arsenal包也支持在原有的统计列基础上新增个性化需求的统计列,但是其可能只能增加一列(可能也是我没调试出来),但一个折中的办法是:将多列合并在一列中;因此还是以lalonde数据集为例,代码如下:
library(arsenal)
library(MatchIt)
data(lalonde)

lalonde$black    <- factor(lalonde$black, levels = c(0,1), labels = c("0","1"))
lalonde$hispan   <- factor(lalonde$hispan, levels = c(0,1), labels = c("0","1"))
lalonde$married  <- factor(lalonde$married, levels = c(0,1), labels = c("0","1"))
lalonde$nodegree <- factor(lalonde$nodegree, levels = c(0,1), labels = c("0","1"))

table_one <- tableby(treat ~ age + black + hispan + married + nodegree, data = lalonde)

mypval <- data.frame(
  byvar = "treat",
  variable = c('age','black','hispan','married','nodegree'),
  adj.pvalue = c("X = 1, P = 0.01", "X = 2, P = 0.02", "X = 3, P = 0.03", "X = 4, P = 0.04", "X = 5, P = 0.05"),
  method = c('Age/Sex adjusted model results')
)
tab_two <- modpval.tableby(table_one, mypval, use.pname=TRUE)
summary(tab_two)
write2html(tab_two, "../Desktop/222.html")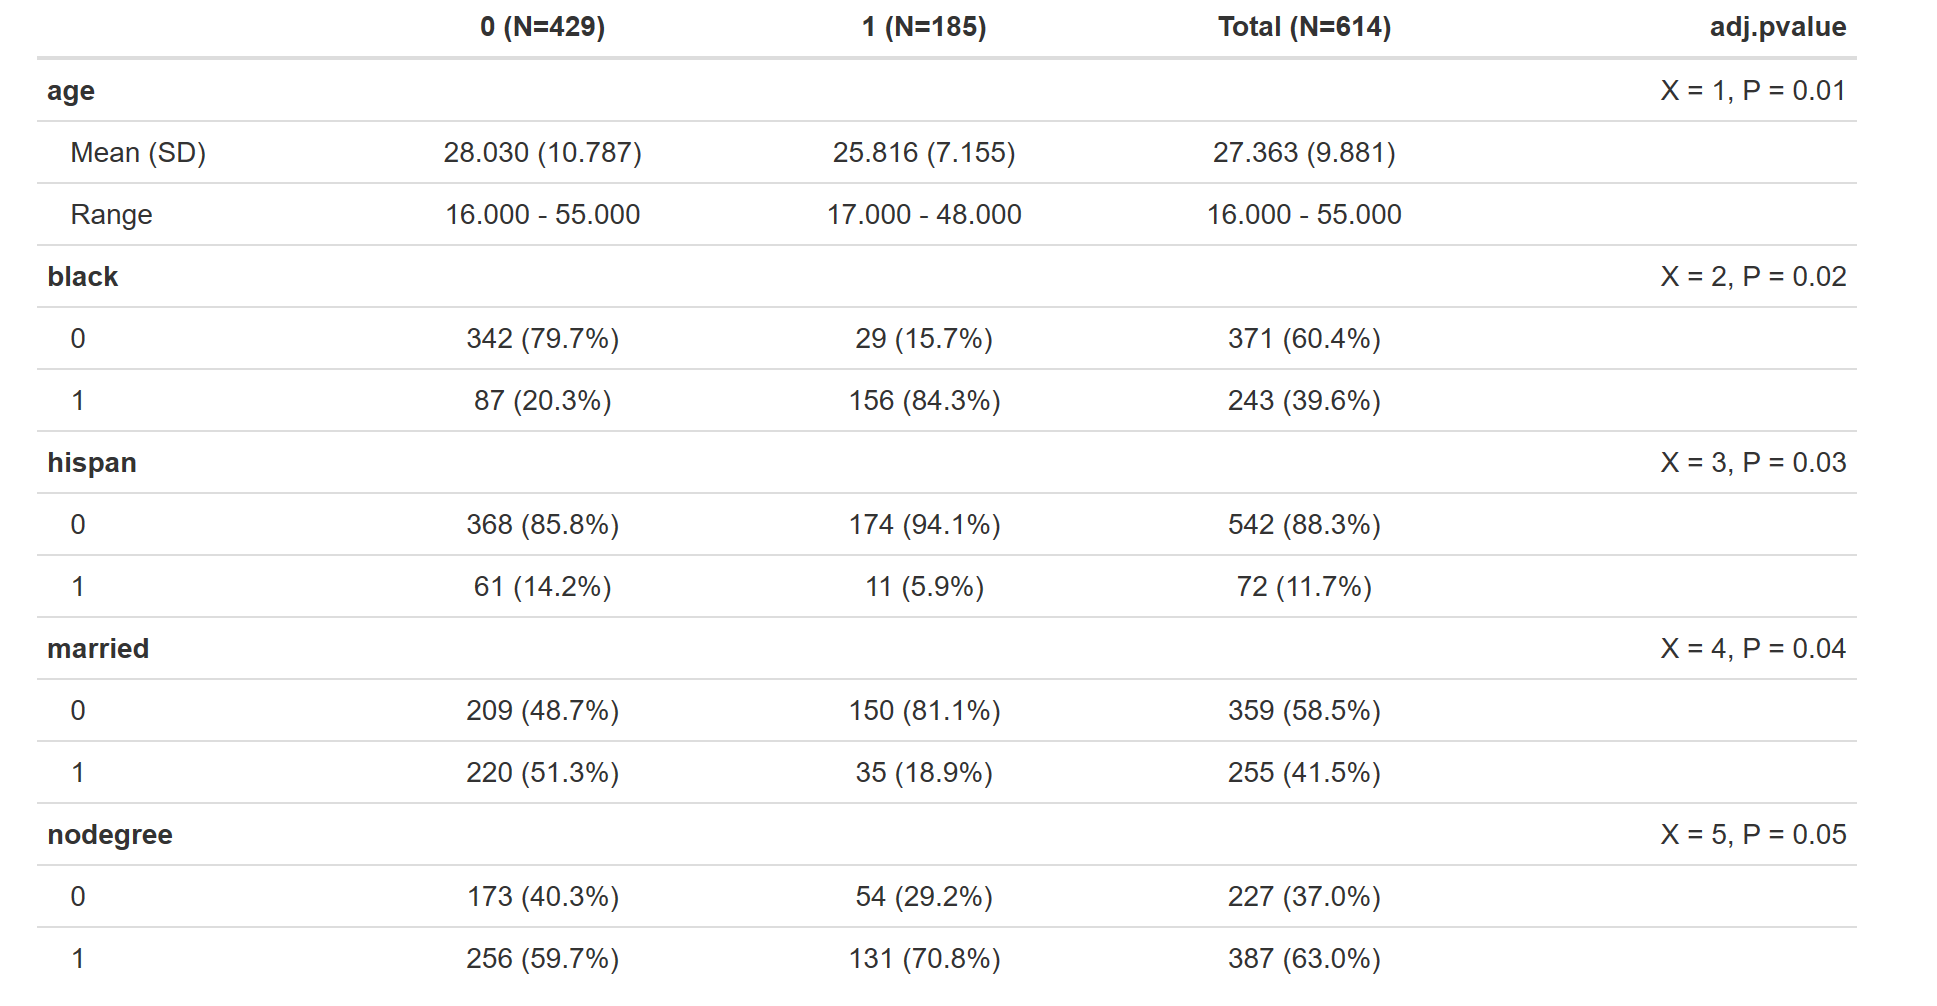
其他样式可参照文档或者参照本文开头的那篇博文。。。
本文出自于http://www.bioinfo-scrounger.com转载请注明出处