Consensus Clustering(一致性聚类),无监督聚类方法,是一种常见的癌症亚型分类研究方法(如乳腺癌中的PAM50),可根据不同组学数据集将样本区分成几个亚型,从而发现新的疾病亚型或者对不同亚型进行比较分析(Justification for using consensus clustering(wiki)) Consensus Clustering的思路是:采用重抽样方法抽取一定样本的数据集,指定聚类数目k并计算不同聚类数目下的合理性(PAC方法)
PAC可用来优化聚类模型选择最优的K值,wiki解释如下:
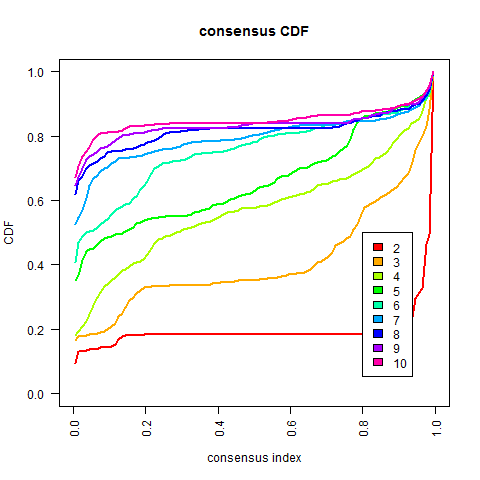
The "proportion of ambiguous clustering" (PAC) measure quantifies this middle segment; and is defined as the fraction of sample pairs with consensus indices falling in the interval (u1, u2) ∈ [0, 1] where u1 is a value close to 0 and u2 is a value close to 1 (for instance u1=0.1 and u2=0.9). A low value of PAC indicates a flat middle segment, and a low rate of discordant assignments across permuted clustering runs. We can therefore infer the optimal number of clusters by the K value having the lowest PAC

从上图可得:一般常用的方法是考虑CDF下降坡度小(在u1-u2范围内的曲线),但有时不一定要遵守这个方法how to choose optimal K in Consensus clustering,可以选择其他K值最优的方法或者按照自己的研究目的来选
除了Consensus Clustering外,还有些大文章会用non-negative matrix factorization (NMF) consensus cluster(R包-NMF)来寻找亚型,如文章:Proteomics identifies new therapeutic targets of early-stage hepatocellular carcinoma(Nature)
Consensus Clustering实现比较简单,有现成的R包ConsensusClusterPlus,操作比较简单,只需要一个表达矩阵(如rawdata.txt),如下:
data <- read.table(file = "rawdata.txt", sep = "\t", header = T, stringsAsFactors = F, row.names = 1, check.names = F)
# 过滤50%缺失值的
data2 <- data[apply(data, 1, function(x){sum(is.na(x)) < ncol(data)/2}),]
data2 <- as.matrix(data2)

res <- ConsensusClusterPlus(data2, maxK = 10, reps = 1000, pItem = 0.8, pFeature = 1, clusterAlg = "pam", corUse = "complete.obs", seed=123456, plot="png", writeTable=T)其结果将会输出k从2-10各个情况下的分型情况,聚类的方法用的是pam,抽样比例为0.8,最后输出png图和csv表格文件
结果文件:
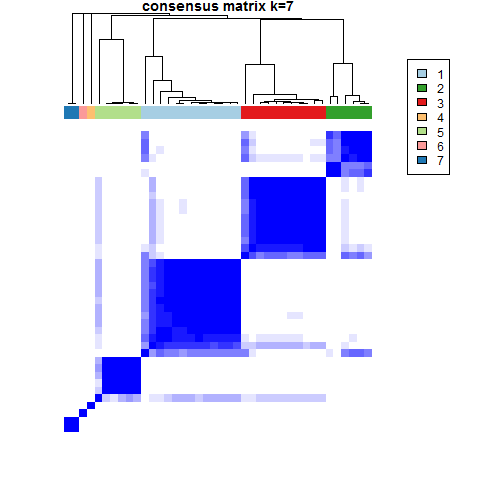

按照上述选择k值的方法,根据这个数据的结果,感觉k值可以暂时选择7~当然也可以根据研究背景的选择来定
确定亚型后,接着可以基于各个亚型来分析:比如绘制不同亚型的表达模型热图、看看某个分类下不同亚型的表达高低差异、做不同亚型之间基因表达的显著性差异以及结合PCA或者共表达网络等等
参考资料:
ConsensusClusterPlus (Tutorial)
本文出自于http://www.bioinfo-scrounger.com转载请注明出处